Image:Pompei.png
Un article de 366 Jours par An.
Pas de plus haute résolution disponible.
Pompei.png (350 × 210 pixels, taille du fichier : 54 ko, type MIME : image/png)
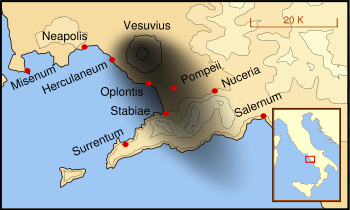
- Description : A map showing the cities and towns (with their Latin names0 which were affected by the eruption of Mount Vesuvius in 79 AD. The general shape of the ash and cinder fall (see w:en:pyroclast) is shown by the dark area to the southeast of Mt Vesuvius.
- This map shows modern day coast lines and uses the Mercator projection (although that is not important on a map of this scale). North is, as usual, at the top of the map.
- Author : MapMaster
- Permission : This map is intended to show the general distribution of (airborne) ash punice, and other particles. I built the map from descriptions of the event as well as these maps:
Luongo, Giuseppe; Perrotta, Annamaria; Scarpati, Claudio;De Carolis, Ernesto;Patricelli, Giovanni;Ciarallo, Annamaria (2003) "Impact of the AD 79 explosive eruption on Pompeii" in Journal of Volcanology and Geothermal Research v126 pp. 169-200.
- This map.
- Image:Pompeya, el Vesuvio y su alcance.jpg
|

Historique du fichier
Cliquer sur une date et une heure pour voir le fichier tel qu’il était à ce moment-là
| Date et heure | Utilisateur | Dimensions | Taille du fichier | Commentaire | |
|---|---|---|---|---|---|
| (actuel) | 7 juin 2008 à 11:49 | Ephemeride (Discuter | Contributions) | 350×210 | 54 ko | {{WC}} * Description : A map showing the cities and towns (with their Latin names0 which were affected by the eruption of Mount Vesuvius in 79 AD. The general shape of the ash and cinder fall (see w:en:pyroclast) is shown by the dark area to the southeas |
- Modifier ce fichier en utilisant un application externe
Voir les instructions pour plus d’informations.
Pages contenant l’image
Aucune page ne contient cette image.
